The Full Story:
Pessimism continues to replenish after hotter-than-expected inflation reports accompany hotter-than-expected economic reports. After a fierce run-up from the October lows, the major stock indices sit right at major technical levels (50-day moving average, 200-day moving average) awaiting directional conviction. Preventing further advances, the entire interest rate complex has risen, as has the US dollar. Higher rates weigh on valuation mathematics, and a higher U.S. dollar weighs on earnings and sentiment mathematics. Fortunately, the run we had over the first six weeks of the year gave us plenty of room for retrenchment. Even with the sudden rise on the 10-year Treasury back above 4%…
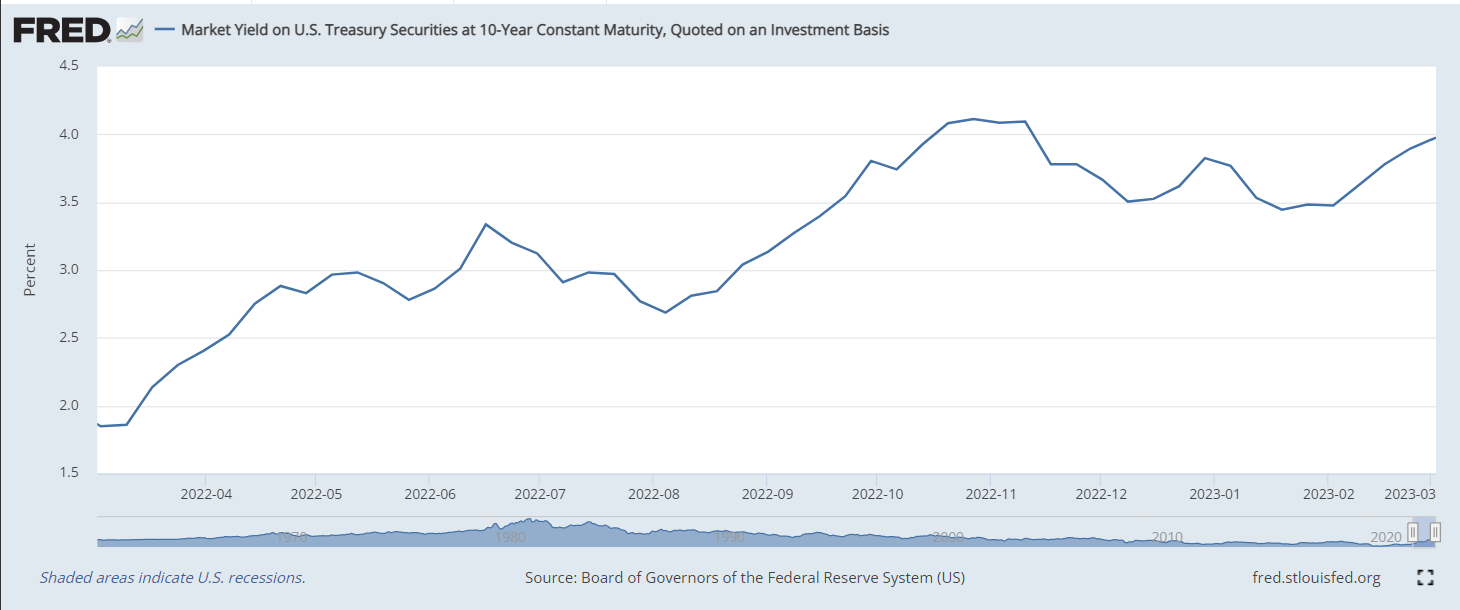
…equity markets remain broadly higher on the year. And while 3% on the S&P 500 may not sound like much, when you annualize that number after only two months, it’s 19%. Outside of the S&P 500, returns rise even higher. Now that we have completed 17% of 2023, let’s do a quick survey to take stock of what’s working so far.
Smaller is Bigger
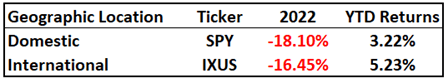
So far in 2023, the smaller companies have risen more than large companies…
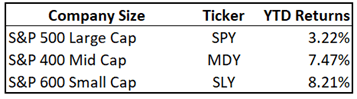
…with the S&P 600 Small Cap index returning 8.2%, the S&P 400 Mid Cap index returning 7.5%, and the S&P 500 Large Cap Index returning 3.22%. We attribute this to a valuation reversion to the mean, which could persist for quite a while. The largest stocks in the S&P 500 became wildly over-owned and over-valued, with the five largest companies in the S&P 500 comprising 26% of the entire index value prior to 2022’s drop:
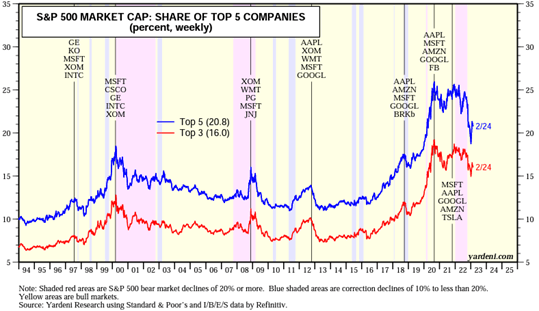
Today, they comprise about 21% of the S&P 500’s index value, well off their 2022 lows, but also well above the Top 5 weight prior to the dot-com reversion. When you compare P/E ratios, the S&P Small Cap index trades at 13.7x earnings; the S&P Mid Cap index trades at 14.2x earnings; the S&P 500 Large Cap index trades at 17.5x earnings, while the Mega-8 (Apple, Amazon, Google, Facebook, Microsoft, Netflix, Nvidia, Tesla) trade for 25.5x earnings. The outsized share of these few companies within the S&P 500 index primarily directs performance. If we compare valuations of the Small Cap index with these mega cap heavyweights, it trades for a 45% discount. This wide valuation disparity invites convergence, presenting small cap investors with ample scope for continued outperformance.
Value Stylin’
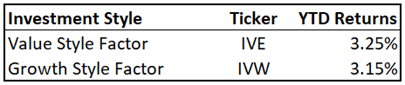
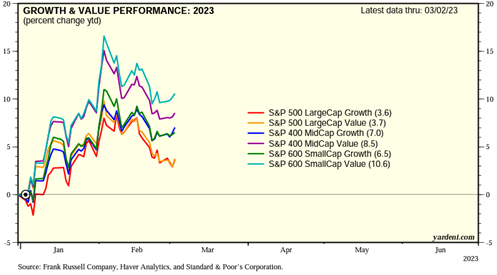
In 2022, the Value investment style, with its lower valuation attributes, dramatically outperformed the Growth style. In 2023, reweighting the factor indices has led to some confusion. In fact, mega caps like Google, Amazon, Facebook, and Microsoft now reside in both the growth and value factor indices after their sizable declines. This explains the near identical returns of the Value investment style and the Growth investment style year to date:
Another way to slice the data is to isolate the returns for the growth-iest of the growth and the value-iest of the value stocks. S&P provides these indices as well, calling them the Pure Style indices. The returns for the Pure Style indices year to date paint a much clearer picture with the S&P 500 Pure Value index up 4.8% versus the S&P 500 Pure Growth index up 1.1%. This divergence grows far larger down the cap spectrum, with the small cap S&P 600 Pure Value index up 13.6% and the small cap S&P 600 Pure Growth index up 5.8%. For 2023 so far, the value style continues to hold the advantage.
Offshore Returns
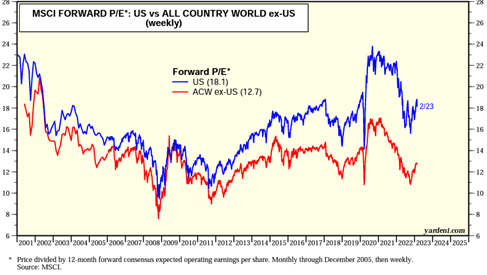
Last year, despite a strong run in the US dollar, war in Europe, and China COVID closures, international shares outperformed US shares by around 2%. Much of this can be attributed to the same “valuation return to the mean” that lifted small cap and international shares. In 2023, the dollar is flat, war still rages in Europe, and China’s economy has reopened. The valuation spread offshore remains compelling at 12.7x vs. 17.5x onshore. Therefore, the story for internationals has marginally improved, as have the returns:
The recent uplift in the US economy, interest rates, and the US dollar have lessened early-year outperformance, but any reversal in these factors will reignite return boosters offshore.
In sum, 2023 differs from 2022 in that it has produced gains. What hasn’t changed is the performance advantage for small caps, the value style, and offshore shares over US large cap stocks burdened by lofty valuations. This market continues to reward lower valuation market segments, which is why we continue to overweight them.
Extra Credit Chart 1: US Size and Style Performance:
Extra Credit Chart 2: USA vs. Ex. USA Valuations:
Enjoy your Sunday!