The Full Story:
Welcome to Superbowl weekend! The outcome of the matchup between the Philadelphia Eagles and the Kansas City Chiefs should hold great interest for football fans and investors alike. Historically, a win by the National Football Conference representative (Eagles) yields greater results than a win by the American Football Conference representative (Chiefs). Below are historical returns post-Superbowl:
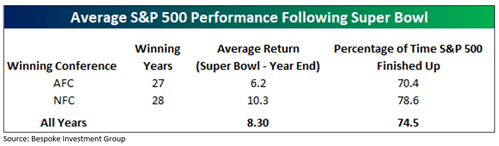
The good news is that despite the outcome, markets tend to rise into year-end. Therefore, as a fan, root for whomever you prefer. But, for investors seeking higher returns, please root for the Philadelphia Eagles.
Fly, Eagles, Fly!
Rally Respite
January’s 6% return for the S&P 500 marked the strongest first month of the year since 2019, with the S&P 500 returning 8% that January. In 2019, the gains continued, with the S&P 500 closing up 30% by year’s end. While we remain optimistic for 2023, a 30% plus return seems somewhat unlikely. However, based on the often-referenced January Indicator, a strong January does have predictive value:
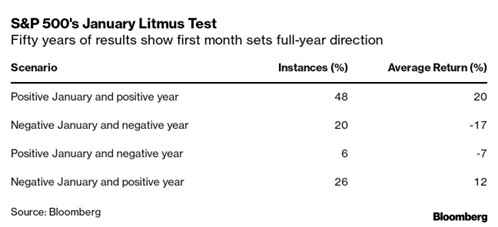
Over the last 50 years, January gains occurred 27 times. Ninety percent of those years ended positively, with the S&P up 20%, on average. However, when we add in negative performance from the previous year, the numbers become even more compelling:
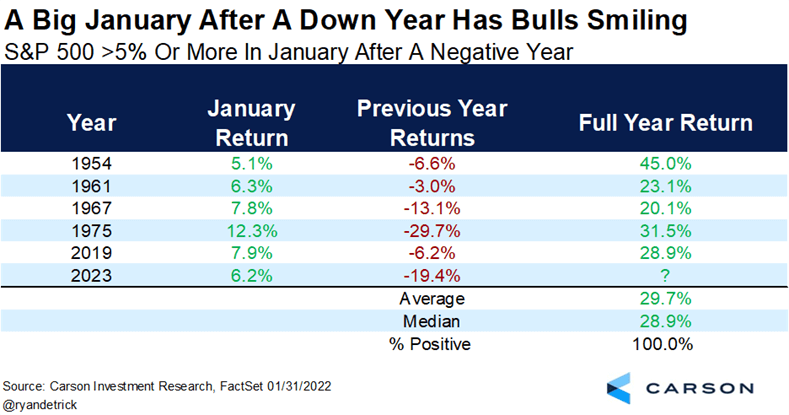
Gains of more than 5% in January, after a year of negative returns, drive full-year returns to +30%, on average. So, while the January Indicator has an encouraging record, the combination of poor prior-year performance with strong January performance adds even more investor enthusiasm! Herein lies the problem.
As Warren Buffett quipped in 1987, “in the short term, the market is a voting machine, but in the long term, it’s a weighing machine.” Therefore, readings on market sentiment provide more reliable forecasts over shorter periods than fundamental readings. Over longer periods, the fundamental readings matter more. Those who follow our content will recognize that whenever I seek short-term trend guidance, I look to the state of retail investor sentiment. There are many available gauges on offer, but CNN’s Fear & Greed composite offers a good quick read:
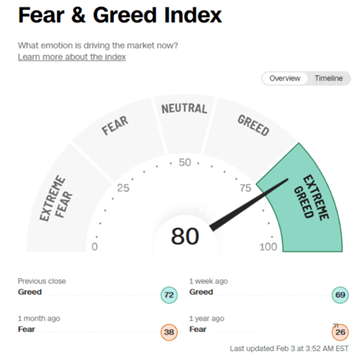
At the current moment, January’s strong returns, after last year’s weak returns, have driven investor optimism to its highest level since late 2021. This does not suggest that markets stand poised to repeat 2022’s dismal performance, but it does indicate that a rally respite seems appropriate. Historically, February is the second weakest month of the year, with the second half of February dragging the most. Given the rapid move in sentiment from fear to greed over the past month, and the record volume of short covering pressing indices higher, this market needs to regroup and find fundamental reasons to rally further.
Fundamental Favor
The January jobs report surprised observers with its strength. Unemployment hit 3.4% in the US, its lowest level since 1969. Fortunately, average hourly earnings in January also fell, despite the surge in employment. This led Chairman Powell to recognize the “disinflationary” trend in a recent speech, surprising markets further. The combination of better-than-expected economic data amidst disinflationary trends seemingly defies economic logic. Adherents to the “Phillips Curve” orthodoxy that employment levels drive inflation levels seem incredulous at best and agitated at worst. In their vernacular, lower unemployment should drive higher inflation, and yet, it hasn’t:
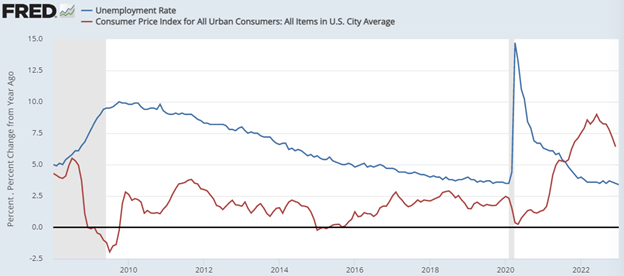
Looking back, after the Great Financial Crisis, economic recovery drove inflation higher while the economy regained its productive footing. By mid-2011, inflation ran at 3.6%, even with unemployment of 9%. After a decade of economic recovery, inflation fell to 2.3%, while unemployment fell to 3.5%. Therefore, over the term of the most recent economic recovery cycle, inflation fell alongside unemployment. Post-COVID, the economic results have been greatly amplified due to the rapid collapse and the record policy response. Inflation surged far higher, and unemployment levels fell far faster. However, as the economy now normalizes, the Phillips Curve fallacy has reappeared. Inflation peaked in June at 9%, with unemployment at 3.6%. Since then, inflation has fallen toward 6% while unemployment has fallen even further to 3.4%. While the Phillip Curvians at the Federal Reserve have Powell’s attention, the data trends may have stoked Powell’s skepticism. This would explain the disconnect between the stronger-than-expected jobs report and Powell’s weaker-than-expected policy guidance. Chairman Powell may prove more independently-minded and pragmatic than expected. Removal of the Phillips Curve filter removes the recession requirement to combat inflation. And that’s a fundamental truth worth rallying over.
Enjoy your Sunday!