The Full Story:
Markets continued their volatile, directionless pattern this week as micro and macro forces continue to clash. Investor debates over inflation and interest rates pressed valuations and markets lower, while continued economic and corporate earnings growth pressed markets higher. This valuations vs. earnings tension has defined the market for the past nine months and confined it within a range between 4200 and 4800 for the S&P 500:
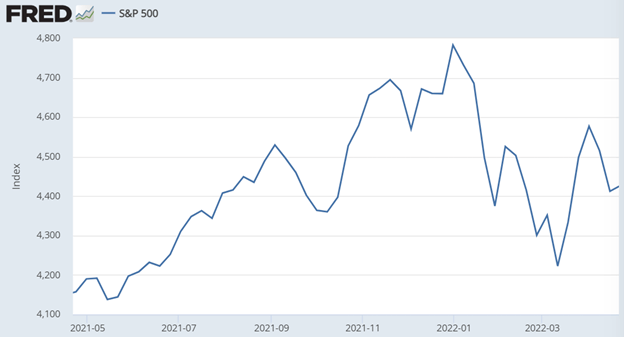
To break out of this range on the upside, we need inflation relief and a cooler Fed. To break out of this range on the downside requires a hotter Fed and an earnings recession. At least this week, fear of the latter held the advantage.
The Search for Neutral
Chairman Powell upended the post-tax relief rally this week with his hawk-talk on Thursday. The media keyed on his revealed intent to raise the Fed Funds rate .5% in May, but to us, his suggestion of ultimately hiking rates “above the neutral level” weighed far heavier. To understand why this so unnerved markets, we must understand how the Fed defines “neutral.” Rates at neutral neither stimulate nor restrict the economy. They do not cause inflation or disinflation. Neutral rate equilibrium today would support the Fed’s 2% GDP growth and 2% inflation targets. Persistently neutral rates, 2% inflation, and 2% GDP growth sound lovely in theory but prove elusive in practice. Note the volatility in the chart below of the Federal Funds Rate, Real GDP, and core inflation over the last half-century:
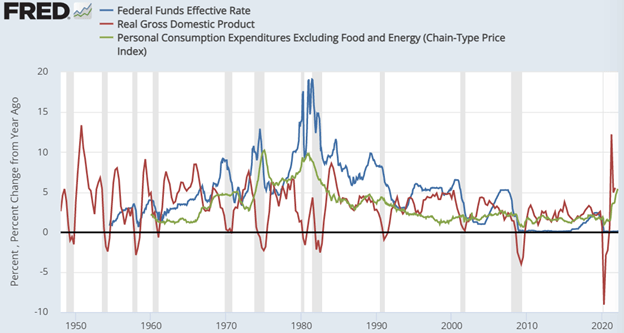
If the Fed could properly identify the neutral rate, wouldn’t volatility abate? It would! But unfortunately, as the Fed knows, neutral changes all the time given the myriad dynamics within the global economy. Therefore, they rely on guesses and best efforts. With inflation running 8.5%, one could strongly argue neutral lies well above current levels. In fact, in instances when core inflation ran 8-9% in the past, the Federal Funds rate averaged 14%. No one expects the Fed Funds rate to climb to 14%, but apparently, in the past, that is what the Fed judged as neutral. Delving further, over the last 60 years while GDP growth averaged 3% and inflation averaged 3.2%, the Federal Funds rate averaged 4.8%. These numbers get distorted by the great inflation of the 1970s, but the averages are the averages. So, on average, the Federal Funds rate has resided 1.6% above the inflation rate. In fact, of the 248 quarters in my database, the Federal Funds rate resided below the inflation rate only 30% of the time. The largest negative spread between the two (Fed Funds minus inflation) exists today at -5.3%:
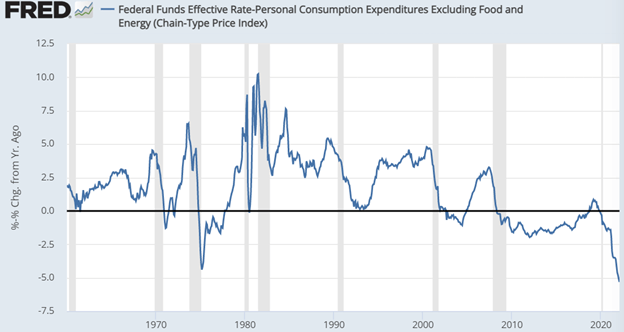
In short, the historically neutral Federal Funds rate has averaged 1.6% more than the inflation rate and currently resides 5.3% below the inflation rate. This is the distance Powell refers to when he states that we are a long way from neutral. For added emphasis, his gesture that the Fed may move “beyond neutral” means even further upside interest rate potential. It is hard to predict how much of Powell’s bark will bite, but it is becoming clearer that he has grown more austere in his thinking as of late, which means higher rates and lower multiples for asset markets. For investors, this makes the most important measure within your stock portfolio the P/E ratio. Stocks with the highest P/Es are the most vulnerable, while stocks with the lowest P/Es are the most protected. For proof, the Van Eck Small Cap Brazil ETF, which may have the lowest P/E for an ETF, has risen 16% on the year. Conversely, the ARK Innovation ETF, which may have the highest P/E for an ETF, has fallen 45% on the year. You can either take down your portfolio P/E yourself by rotating into lower P/E investments or you can let Jerome Powell and the Fed do it for you through forceful price declines.
The E
While Jerome and the Fed may have reloaded the valuation firing squad, corporate earnings continue to fire on all cylinders. Of the 95 companies within the S&P 500 that have reported Q1 earnings so far, 77% have beaten estimates with a median of 6% upside surprise. Analysts now expect 6.6% earnings growth for the quarter versus the 4.7% anticipated before reporting began. Profit margins have managed to maintain loft as well, coming in at 12.3% versus 12.4% last quarter. Although that’s a slight quarterly downtick, 12.3% still ranks within the top five quarterly profit margins reported since 2008. For the remainder of the year, analysts actually expect accelerated profit growth. For Q2, analysts expect 7% growth, 11.7% in Q3, 11.2% in Q4, and 10.9% for the full year, a full 5% above the average long-term growth rate for S&P 500 earnings. In an environment of turmoil and confusion, corporations have found ways to produce profits…and prevent the correction in valuations from metastasizing into something far worse.
Have a great Sunday!