The Full Story:
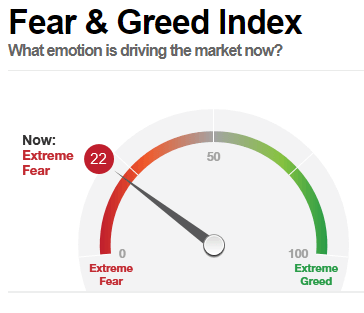
Guaranteed Returns! No Downside! Buy Gold! Never Pay Taxes Again! Have you ever received emails with these headlines? I sure have. In fact, my inbox swells with these solicitations anytime the news gets negative. CNN created their own investor sentiment gauge, known as the Fear and Greed Index, to assess the investor moods they contribute to creating. Here is how it reads today:
The current source of fear? Afghanistan! Delta! Taxes! Inflation! Bubbles! The Taper! China! As news wires force-feed these concerns onto retail investors, their bearish sentiment rises as does the volume of fear-inducing solicitations. Investors must be particularly susceptible right now. As of August 18th, 35.1% of investors surveyed by the American Association of Individual Investors identified themselves as “bearish” versus 33.2% that identified themselves as “bullish”. Subtracting the number of bears from the number of bulls leads to a “Bull/Bear ratio” of -1.9%. That’s only the second negative reading this year and the largest negative reading since October 8th, 2020. Let’s check the headlines on that day:
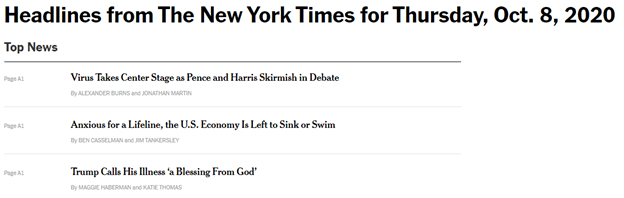
No wonder nerves were frayed! Now, I do not have a way to track gold and annuity sales volumes on that day (all fear-inducing solicitations lead to gold and annuity offerings), but I bet they were high. Were investors rewarded for taking the bait? Three months after those headlines printed, the S&P 500 stood 11% higher and six months later the S&P 500 stood 19% higher. So no, annuities and gold did not prevail. But maybe those returns are atypical given all the monetary and fiscal stimulus present? OK, let’s dig further. Going back weekly to July of 1987, I found 21 instances where the Bull/Bear ratio registered between -1 and -2. I have listed them below:
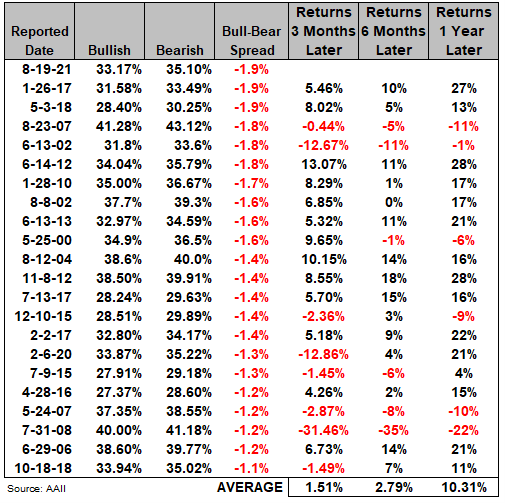
A little data crunching reveals that three months after Bull/Bear readings of -1 to -2, the S&P 500 gained 1.5%, on average. Six months after Bull/Bear readings of -1 to -2, the S&P 500 gained 2.79%, on average. Twelve months after Bull/Bear readings of -1 to -2, the S&P 500 gained 10.3% on average. This does not mean that each of the 21 occurrences led to higher returns. In fact, readings in 2002, 2007 and 2008 accurately predicted negative returns over each of the subsequent periods. And with recessions ahead, investors were right to be concerned! Should we be worried about an impending recession today?
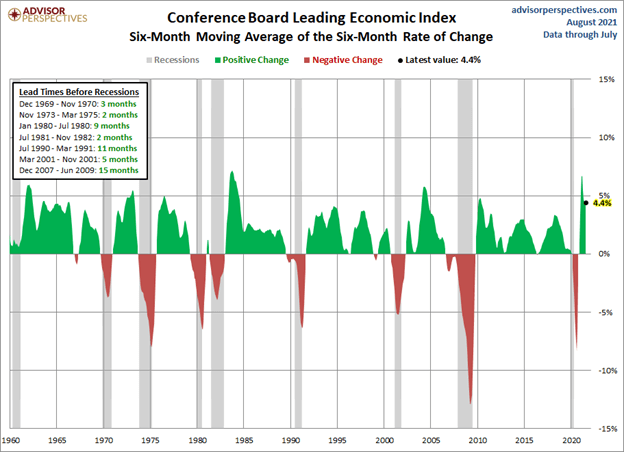
At W&A, we closely monitor the Conference Board’s index of leading economic indicators as our primary recessionary indicator. We focus, specifically, on the six-month moving average. Other than the COVID/government-mandated recession of 2020, this index has had a nearly perfect record of signaling on-coming recessions with lead times anywhere between 2 to 15 months ahead once the index turns negative. In fact, the deterioration of this index towards the end of 2019 informed our decision to hedge our equity portfolios into 2020. No, we did not see COVID coming, and neither did the index, but the economy was beginning to sputter, leading to legitimate concerns. Nonetheless, current readings across the Conference Board’s Leading Economic Index aren’t anywhere close to negative…inspiring expansionary optimism, not recessionary pessimism:
With recession probabilities low, let’s remove the recessionary periods from our Bull/Bear analysis and recalculate returns:
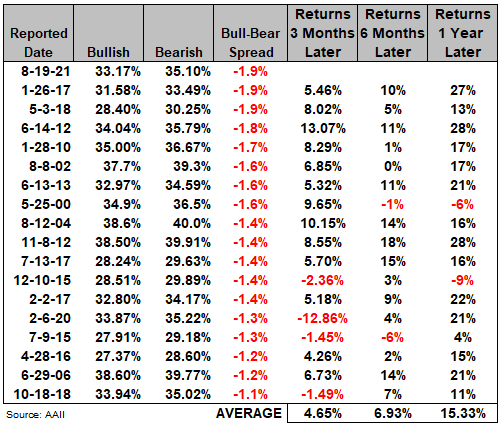
Absent the recessionary periods, returns and positive occurrences across our data set improve dramatically. On average after Bull/Bear readings of -1 to -2 in non-recessionary periods, the S&P 500 has gained 4.65% over the next 3 months, 6.93% over the next 6 months and 15.33% over the next 12 months.
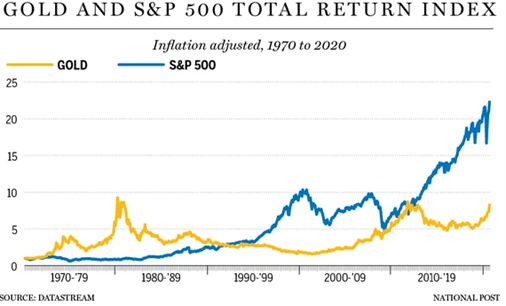
P.S. I did not calculate the return of gold and annuities over the time periods for comparison because I already know they don’t compare. Annuities come in millions of versions, but they always carry fee loads that drag on performance, making even the most aggressive annuities laggards in up markets. As for gold, overall returns since 1970 stem from big moves between 1976 to 1980, and 2001 to 2011. On an inflation adjusted basis, gold has not appreciated in 40 years:
Have a great Sunday!