The Full Story:
I spend a lot of time inside my head trying to decide what matters most in a never-ending storm of data. Is it the rise in Delta? Is it the $1 trillion infrastructure bill? Is it the $3.5 trillion reconciliation bill? Is it the jobs number? The inflation number? The earnings guidance? The change in rates? The ambivalence of the US dollar? On any given trading day it can be any one of these things, but beneath the headlines is always one data point that rules them all…and right now that data point is global liquidity.
How’s Business?
According to Factset, companies within the S&P 500 grew their revenues (or sales) 24.7% last quarter. Analysts estimate revenue growth of 14% for the third quarter and 11% for the fourth. In the most recent quarter, 87% of companies beat their revenue forecasts by an average margin of 4.9%. Both are records, setting the stage for further surprises into year-end. For the full year, analysts project 14.3% revenue growth overall. The long run average for corporate revenue growth approximates nominal GDP, or 3.4% annualized, over the last 10 years. So right now, companies are seeing sales run rates 4x higher than normal.
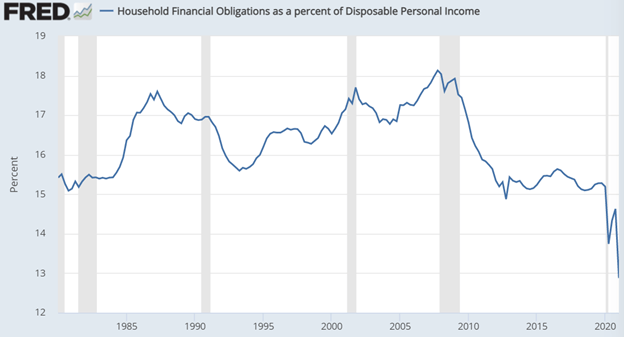
According to the Federal Reserve, at the end of the first quarter this year, US households had a net worth (assets minus debts) of $137 trillion dollars. At the end of the first quarter in 2020, this number was $111 trillion. Over the past year, US households have amassed an additional $26 trillion in net worth, a 23% gain compared with a long-term average growth rate of 5.7% over the last 20 years. The Fed also reported that personal incomes rose 16% at the end of the first quarter, compared with a 5% long-term average. So right now, individuals are seeing personal income gains 3x higher than normal and net worth gains 4x higher than normal. As a bonus data point, households also have $2.4 trillion in excess savings and the lowest debt service ratio since 1980, which bodes well for continued growth:
In sum, corporate sales are growing 4x higher than normal, household net worth is growing 4x more than normal and household incomes are growing 3x higher than normal. Astute observers will recognize that fiscal stimulus programs have turbocharged this recovery and they are right. But before the government handed out money… they had to create it.
The Data Point That Rules Them All
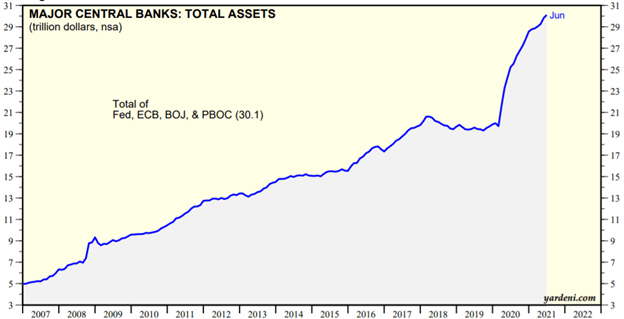
The chart above aggregates the total assets of the US Federal Reserve, the European Central Bank, the Bank of Japan, and the Peoples Bank of China. To acquire assets, central banks need money just like we do. The big difference is that you and I cannot print money.
They can… and have.
Since the beginning of the pandemic, these major central banks have printed approximately $11 trillion dollars and injected them into the marketplace. That amounts to a 58% increase in assets for them and 58% more money supply for us… over the past year!
Think about that.
Today there are 58% more dollars circling the globe than there were before the pandemic. Let me say that once more for emphasis… today there are 58% more dollars circling the globe than there were before the pandemic. Since we denominate GDP, revenues, earnings, and net worth in dollars, you do not need to be an economist to recognize that 60% more dollars means more GDP, revenues, earnings, and net worth. For those of you shouting “inflation!”, you missed a middle step. Much of this liquidity gets handed to the banks and then handed right back to the Fed unless there is equal loan demand. Before the pandemic, banks held $1.7 trillion in deposits with the Fed. Today they hold $3.8 trillion. Within the banks themselves, customers stashed $13.4 trillion pre-pandemic compared with $17 trillion today.
The Fed has never been this flush with bank deposits and banks have never been this flush with customer deposits. Inflation requires money to circulate. The amount of money that has been created well exceeds the demand for money, leading to a collapse in monetary velocity. According to the Fed, monetary velocity fell 18% between Q1 2020 and Q1 2021. Therefore, while the money supply rose substantially, monetary velocity fell substantially, helping keep inflation (mostly) in check. Nonetheless, the historic stock of money, much of it idle today, will get called, and represents historic gains in GDP, revenues, earnings, and net worth in the future. The globe has never experienced this much monetary expansion; expect other significant expansions to follow.
Have a great Sunday!