The Full Story:
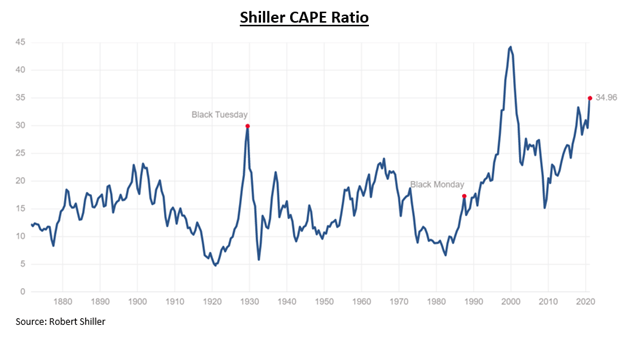
This week we were fortunate enough to have a private conversation with Nobel Prize-winning economist Robert Shiller. Those of you who track markets may recognize his name in association with the CAPE (Cyclically Adjusted Price to Earnings) ratio, his most famous contribution. Without boring you with the details, Professor Shiller uses 10 years of S&P 500 earnings, dividend, and inflation data to calculate his storied valuation metric (click here for his dataset). In practice, his equation reduces the noise of “point in time” P/E ratios, theoretically providing a truer measure of valuations. Market pundits often cite the current Shiller P/E level as evidence of excessive valuations for stocks. They certainly have cause. Here is the Shiller CAPE ratio beginning in 1871:
Yikes! At 35x, valuations stand near historic highs, only eclipsed by the silliness of the late 1990s. In fact, looking at nearly every other closely followed valuation metric, this market seems wildly overvalued:
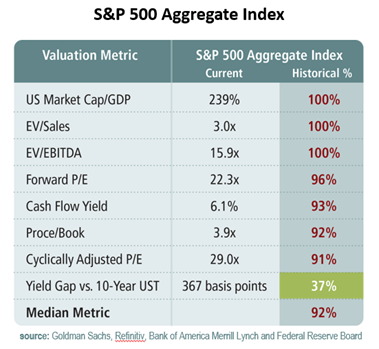
As shown, US market cap to GDP (Warren Buffett’s favorite valuation indicator) is in the top percentile, as is enterprise value to sales, and enterprise value to EBITDA. At 22x, 1-year forward P/Es clock in at 96% of historical comps, and the CAPE at 29 (its year-end level) sits within the top decile. Uh-oh, should we sell?! Fortunately, one valuation metric does appear encouraging. When comparing the earnings yield on the stock market with the interest rate yield on the bond market, stock valuations register in the 37th percentile of historic readings. Since the stock market and the bond market compete for capital, this means the stock market represents far greater value than the bond market. We believe this valuation ratio is the only one that really matters, and thankfully Professor Shiller agreed.
The New and Improved Shiller CAPE
Professor Shiller mused with us that while the current CAPE ratio appears high relative to itself, it is relatively low given prevailing interest rates. In fact, to rebuke pundits who rely on his historic CAPE levels for investor nightmare fuel, he developed another measure: the Excess CAPE Yield. This measurement inverts the CAPE to reveal its earnings yield (33 CAPE = 3% earnings yield), then subtracts the 10-year Treasury yield (1.45%) and adjusts for inflation. The current calculation computes an Excess CAPE Yield of 3.44%. How does this compare historically?
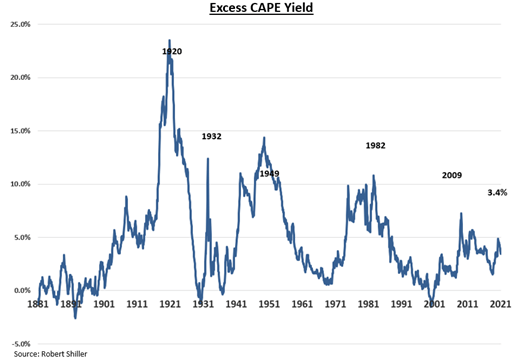
Well, that’s a much different picture. The massive advantage for stocks rightfully ignited the rally in the flapper era. The golden age rally of the 1950s and 60s began with a similar advantage. The bull markets of the 80s and 2010s began at similar peaks. Today’s measurement at 3.4% appears moderately lower than the long-term average of 4.6%, but it’s well below the negative levels hit at the dot-com top. To validate these simple observations, Shiller goes a step further and plots actual forward 10-year stock returns vs. bonds to assess the measure’s predictive power.
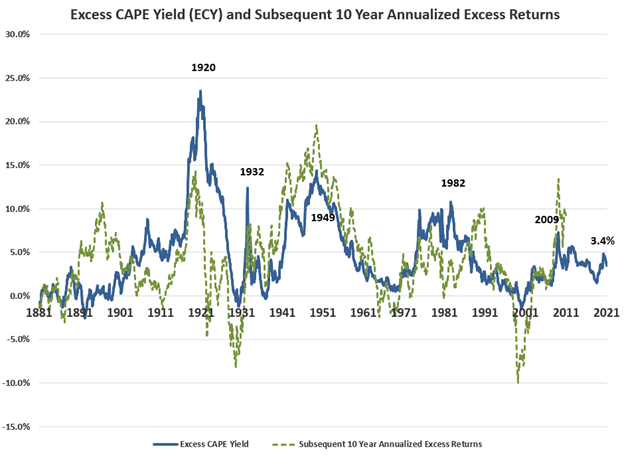
Clearly, a correlation exists between the Excess CAPE Yield and the level of excess returns for stocks vs. bonds over the subsequent decade. But by just isolating stock market returns, we can judge the strength of the relationship, and perhaps even inform our forecasts for the decade to come.
The highest Excess CAPE Yield hit 23.53% in December of 1920. Over the next 10 years, the stock market returned an inflation-adjusted 17% annualized. The lowest Excess CAPE Yield hit -1.52% in January of 2000. Over the next 10 years, the stock market returned an inflation-adjusted -3% annualized. Relationship validated. Now, let us reformat the data set to isolate historical Excess CAPE Yields approximating our current 3.44% and trace forward inflation-adjusted stock market returns over the next 10 years:
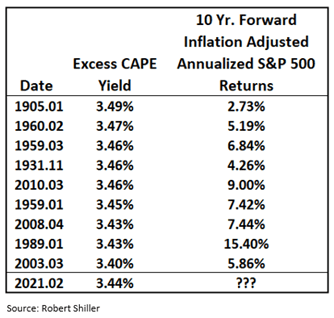
Historically, when the Excess CAPE Yield approximated 3.4%, the S&P 500 returned an inflation-adjusted 7.13% on average over the next 10 years. With the Fed dedicated to achieving an inflation rate of 2%, that implies a 9%+ rate of return for the S&P 500. That’s good… but it gets better. When looking abroad, Excess CAPE Yields climb markedly higher. In the UK, the Excess CAPE Yield nears 10% and around 6% in Europe and Japan. This underscores our belief that international equities will outperform the S&P 500 over the next decade, just as they did between 2000 and 2010. Either way, equities in the US do not appear overvalued and equities outside the US look downright cheap… just as Professor Shiller himself explained to us earlier this week. Thanks, Doc!