The Full Story:
Markets firmed further this week as regionally higher coronavirus case counts battled stronger than expected economic reports and whispers of further stimulus. Having essentially plateaued over the last 20 trading days after a historic burst higher, the major indices seem almost contemplative. Have we come too far? COVID will pass and the economy will recover – whether it’s a 12 or 24-month recovery period isn’t really material. Corporate earnings will outpace the economic recovery as marketplace consolidation and corporate austerity measures should jolt profit margins higher when revenues do return. In short, the economy will grow, earnings will grow even faster, and shareholders will be rewarded… the knowledge of which has fueled the advance to this point. Now, the fundamental debate has turned toward valuation levels. Have we priced this recovery correctly?
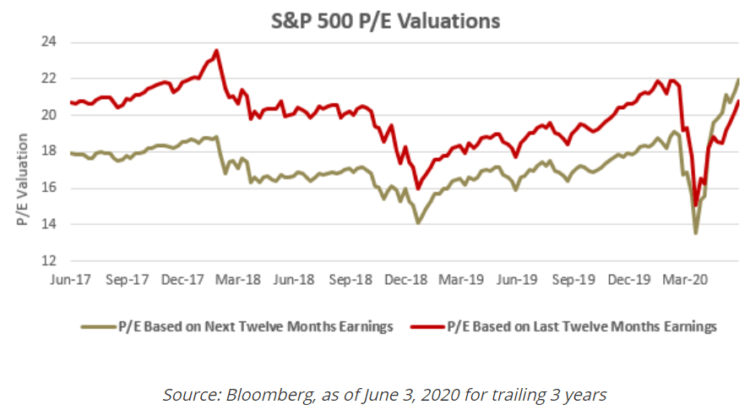
When considering valuation, investors must decide WHICH valuation metric matters most. The image below shows price to earnings ratios for the S&P 500 over the last three years. The green line represents the price to earnings ratio based upon earnings estimates over the next year. Currently, this ratio sits well above average for the time-period due to COVID consequences. The red line represents the price to earnings ratio for the S&P 500 based upon actual earnings data over the past year. This ratio sits spot on the average for the time-period, recognizing only a fraction of COVID’s consequences.
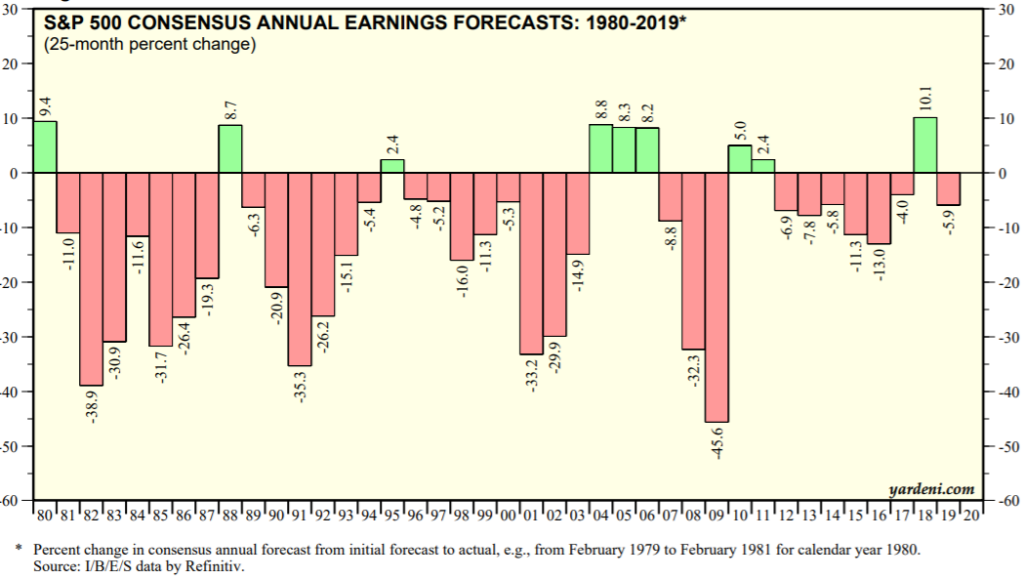
While measuring valuations using future data makes intuitive sense, analysts struggle with forecasting the future correctly. Trailing earnings have happened, future earnings MAY happen. For example, analysts expected the S&P 500 to earn nearly $180 per share entering 2020. They have since recalculated down to less than $130. After the last recession, analysts predicted S&P 500 companies would earn $75 a share in 2010. They earned $85. Judging valuation levels based upon predicted earnings has always seemed problematic to me. During expansions, analysts tend to overestimate earnings growth and have had to revise forecasts lower. During recessions, analysts tend to underestimate earnings growth and have had to revise forecasts higher. This chart shows the direction of revisions roughly two years prior to year-ends.
Clearly, analysts struggle to predict the future, but who doesn’t? For this reason, I prefer trailing P/E analysis. Even still, for those asserting that stocks are expensive based upon trailing earnings, they are ABSOLUTELY correct.
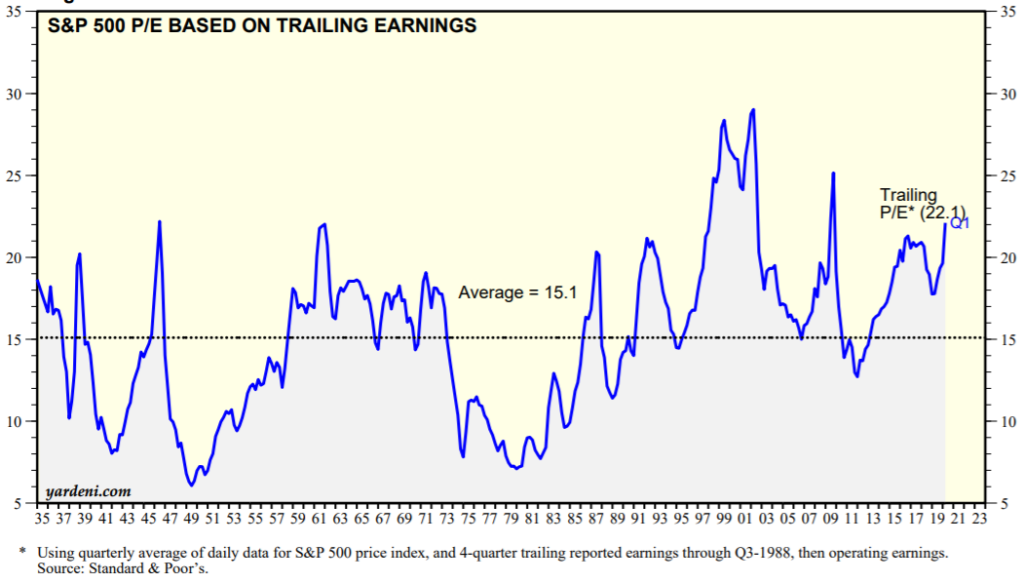
But they are RELATIVELY incorrect. Remember, investment decisions are largely point-in-time, comparative decisions. Do I want to buy stocks, bonds, gold, real estate or Bitcoin right now? First, investors may assess absolute levels (“gee at 22x trailing earnings, stocks look pretty pricey”) but will ultimately move on to assess relative levels. The stock and the bond market spar vigorously for investor favor. Let’s consider the relative valuation currently of stocks versus bonds. To do this, we convert the P/E of the stock market to an “earnings yield” (retained cash payments) to compare with the “yield” (distributed cash payments) of the bond market. At a P/E of 22x, the stock market has an earnings yield of 4.5%. Currently, the 10-year Treasury bond has a yield of .7%. The investment grade corporate bond market hit a record low yield of 2.23% on Thursday. Not only do stocks have an earnings yield of 4.5%, they also have a “dividend yield” of 1.9%. That’s a 6.5% return complex for corporate equities compared with a 2.23% return for corporate bonds. When we look at RELATIVE valuations, stocks are cheap.
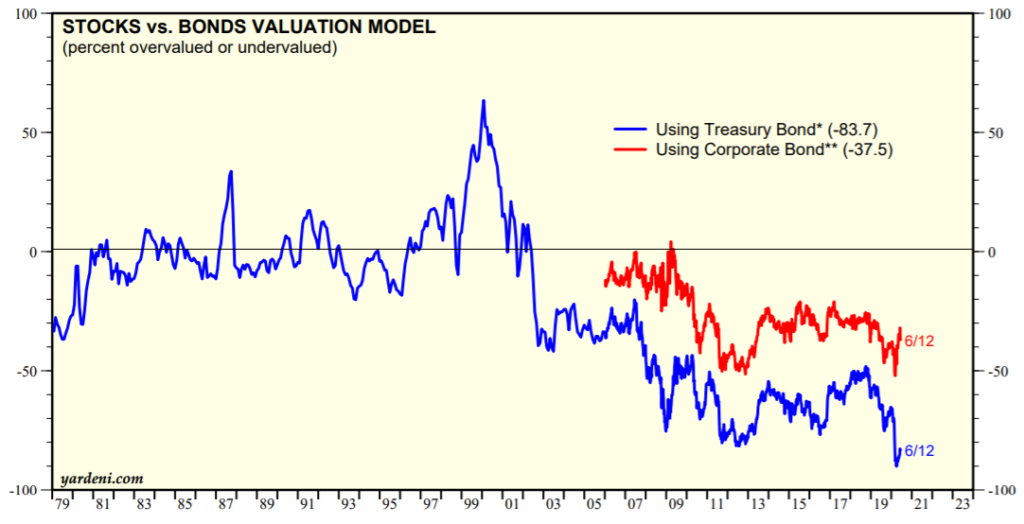
Lastly, using the S&P 500 to assess overall stock market valuation isn’t fair. The S&P 500 is a capitalization-weighted index where the top stocks disproportionately influence the valuation metrics, and most happen to be highly valued tech stocks. Viewing the market more comprehensively tells a different tale:
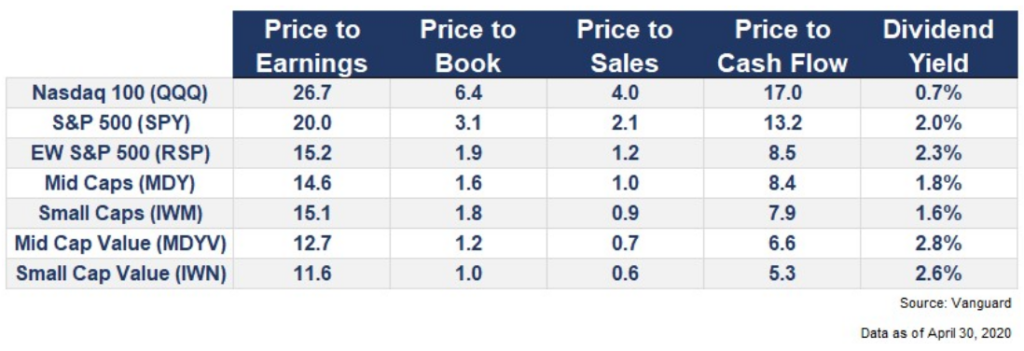
Using the framework from above, investment grade corporate bonds yield 2.3% compared with a yield complex of 6.5% for large-cap stocks. If we look elsewhere in the stock market, we can improve this differential. Small-cap value stocks as indicated in the table have a yield complex of 11.2% (earnings yield of 8.6% + a dividend yield of 2.6%). Obviously, these stocks carry more risk so maybe we should compare them with lower grade bonds. The high-yield corporate bond market currently yields 6.4%. Which would you choose?
Unless we see a dramatic spike higher in inflation expectations, interest rates will remain anchored at unprecedentedly low levels, providing equity valuations with ample justification for unprecedentedly high levels. Add in the positive post-recession earnings surprises and this recovery could be worth a lot more for investors.